
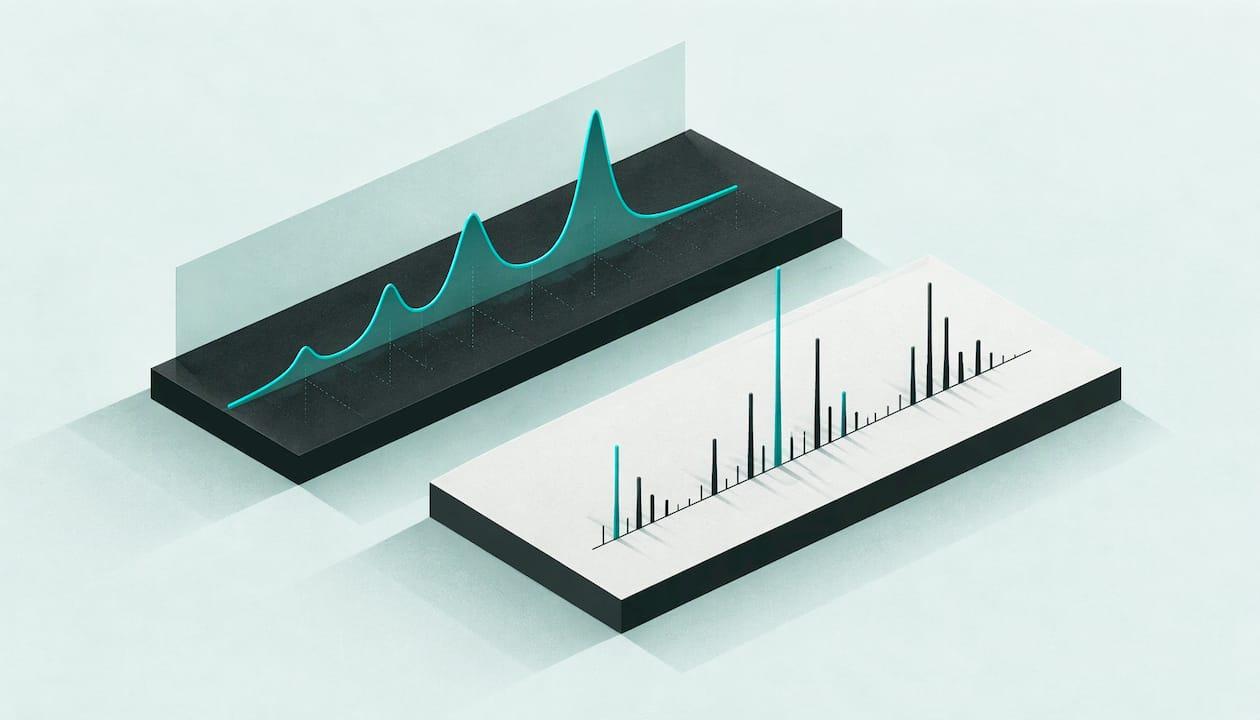
An LC-MS run gives you two linked pictures, not one: a chromatogram that shows when things elute, and a mass spectrum that shows what they weigh. To interpret the data, pick a peak in the chromatogram, open the mass spectrum at that retention time, work out the charge state and adducts, and compare the resulting mass with the one you expect. At BioForgeUK we supply research peptides at 99%+ HPLC purity for laboratory use, and the steps below are the ones a lab applies when it checks that a peptide is what its paperwork says.
TL;DR
- LC-MS data has three dimensions: retention time, m/z and intensity. A plot against retention time is a chromatogram; a plot against m/z is a mass spectrum.
- Peptides carry several charges, so one compound appears as a series of peaks (2+, 3+ and so on). Convert each m/z back to a neutral mass before comparing it with theory.
- Sodium and potassium adducts sit at predictable offsets from the protonated ion, so label them before you suspect an impurity.
- Intact-mass LC-MS confirms molecular weight; fragment (MS/MS) spectra are needed to confirm sequence order.
- Report the method parameters with the spectrum, or nobody can reproduce your reading.
Table of Contents
- Two displays from one run
- A step-by-step reading routine
- Worked example: reading a five-residue peptide
- What LC-MS confirms, and what it does not
- Pitfalls that distort interpretation
- Reporting LC-MS results so others can reuse them
- Starting from material you can verify
- Our perspective
- FAQ
- Sources
Two displays from one run
The first mistake beginners make is treating "the LC-MS spectrum" as a single graph. Shimadzu's guide to LC-MS data describes three dimensions: retention time, m/z (mass-to-charge ratio) and ion intensity. Keep intensity on the vertical axis and the horizontal axis decides what you are looking at:
| Horizontal axis | Display | What it tells you |
|---|---|---|
| Retention time | Chromatogram (TIC, BPC or EIC) | When ions arrive, how many peaks there are, how well they separate |
| m/z | Mass spectrum | Which ions make up one peak, their charge states and adducts |
A total ion chromatogram (TIC) sums all ions in the scanned range. An extracted ion chromatogram (EIC, also called a mass chromatogram) plots one chosen m/z only. Qualitative work combines both: retention time from the liquid chromatography and m/z from the mass spectrometer.
The xcms tutorial from Louail and Rainer makes the same distinction at peak level. A chromatographic peak is the signal of an ion along retention time; a mass peak is a signal along m/z inside one spectrum. Their example shows a strong signal near 180 seconds that likely represents the [M+H]+ ion of serine, found by extracting the m/z of interest across the whole run.
Know which scans built the picture
Before you read any trace, ask which scans contributed to it. MassSpec.Tips points out that two screenshots both labelled "TIC" can disagree when scan filters or mass ranges differ, and that extraction cannot recover an ion from scans that never measured its m/z region. It also stresses that the label (TIC, BPC, XIC) does not turn the vertical axis into a concentration scale. Check the acquisition range and filters first; it saves hours of chasing phantom peaks.
A step-by-step reading routine
Step 1: Scan the chromatogram
Note the number of peaks, their retention times and relative heights. For a purified peptide you expect one dominant peak. Smaller peaks may be related substances, but the chromatogram alone does not say what they are. Our guide to interpreting an HPLC chromatogram covers integration, baselines and peak area, which carry over directly to the LC trace in an LC-MS run.
Step 2: Open the mass spectrum under the peak
Average the scans across the peak apex rather than picking a single scan on the shoulder. The mass spectrum plots relative ion intensities against m/z at that time point. In the Shimadzu fundamentals guide, the spectrum supplies molecular mass and structural information that supplements identification by retention time. The Agilent LC/MS primer likens the pattern to a fingerprint and notes that LC/MS can resolve co-eluting peaks by mass.
Step 3: Identify the charge states
Electrospray ionisation (ESI) is a "soft" source: it imparts little energy and causes little fragmentation, according to the clinical biochemistry review by James Pitt. Small molecules below roughly 500 Da give mostly singly charged ions, [M+H]+ in positive mode or [M–H]− in negative mode. Peptides and proteins pick up several charges (M+2H 2+, M+3H 3+ and so on), which is why a protein of up to 100 kDa can be measured on an instrument that scans only to 4000 m/z.
In a multiply charged spectrum, each peak is a different charge level, and lower m/z means higher charge, as the Waters LC-MS primer explains. You can also infer charge from the isotopic envelope: the spacing between isotope peaks narrows as charge rises, a point made in the Omics Data Analysis chapter by Gatto and Loriot. Two peaks one unit apart mean a charge of 1+; peaks half a unit apart mean 2+.

Step 4: Convert m/z back to neutral mass

The general relationship, given in the UAB metabolomics pre-processing workshop, is m/z = (N × compound mass + mass shift) ÷ charge state. For a simple protonated ion the mass shift is 1.007276 per proton.
A hypothetical example. Suppose a peptide has a monoisotopic neutral mass of 1,000.000 Da:
- [M+H]+ appears at (1,000.000 + 1.007276) ÷ 1 = 1,001.007
- [M+2H]2+ appears at (1,000.000 + 2.014552) ÷ 2 = 501.007
- [M+3H]3+ appears at (1,000.000 + 3.021828) ÷ 3 = 334.341
If your spectrum shows peaks at 501.007 and 334.341, you have the 2+ and 3+ forms of the same molecule. Working in reverse, multiply the observed m/z by the charge and subtract the protons. For small peptides this is a manual calculation; for larger molecules the instrument software performs deconvolution, as the Waters primer notes.
Step 5: Label adducts before calling anything an impurity
When salts are present, the same molecule shows up at other positions. The UAB workshop lists the mass shifts:
| Ion | Mass shift |
|---|---|
| [M+H]+ | 1.007276 |
| [M+2H]2+ | 2.014552 (divided by 2) |
| [M+Na]+ | 22.98977 |
| [M+K]+ | 38.963708 |
| [M+H–NH3]+ | −16.01872 |
The gap between the sodium and proton adducts is 22.98977 − 1.007276 = 21.982 Da. A satellite peak 21.98 above your main ion is therefore the sodium adduct of the same peptide, not a new compound. The Pitt review also records ammonium and potassium adducts, and formate or acetate adducts in negative mode. Note too that in-source fragmentation can be increased by raising source voltages, so a peak below the parent may be an artefact of settings rather than a degradation product.
Step 6: Compare with the expected mass
Calculate the theoretical monoisotopic mass from the sequence and compare it with the deconvoluted value. A match within your instrument's mass accuracy supports identity. This is an intact-mass check: it confirms molecular weight, not the order of residues. Two sequences with the same composition share a mass, which is why fragmentation matters.
Step 7: Use MS/MS to read the sequence
In a tandem experiment, a precursor m/z window is selected and fragmented by CID, HCD or ETD. The fragment pattern is then used for de novo sequencing or a database search, as the Gatto and Loriot chapter describes. The Pitt review calls the product-ion scan a structural fingerprint that can confirm identity with great certainty.
Worked example: reading a five-residue peptide
Separation Science's walk-through by O. David Sparkman uses the peptide MYGAV (methionine, tyrosine, glycine, alanine, valine). Its protonated molecule appears at m/z 540 and is chosen as the MS/MS precursor.
- Find the y ions. The first y ion at m/z 409 sits 131 below the precursor. 131 is the residue mass of methionine, so methionine is at the N-terminus.
- Read the other end. The y1 ion at m/z 118, minus 19, gives a residue mass of 99, which is valine at the C-terminus.
- Check the b ions. Neutral losses of residue mass plus 18 give the b series; the first b ion in the example identifies valine.
- Confirm by summing. Add the residue masses, then 17 for the C-terminal –OH, 1 for the N-terminal hydrogen and 1 for the proton. The total reproduces the precursor at 540.
The sum check is the habit worth keeping. If the arithmetic does not return the precursor, an assignment is wrong, however convincing the fragment labels look. For longer sequences without a reference, our guide to de novo peptide sequencing explains how the same logic scales up, and reading mass spectra of peptides goes deeper on fragment ladders.
What LC-MS confirms, and what it does not
Intact-mass LC-MS answers "is this the molecule I ordered?" MS/MS answers "is the sequence right?" Neither is, on its own, a purity figure. Purity in the sense of a certificate normally comes from the UV chromatogram area by HPLC; see how to read the HPLC purity number for what it does and does not include. The two methods are complementary: HPLC tells you how much of the signal belongs to the main peak, and mass spectrometry tells you what that peak is.
This is also why laboratories ask for a full certificate with each batch. Our guide to reading a peptide Certificate of Analysis shows how the identity and purity entries fit together, and the overview of LC-MS peptide analysis sets out what each result confirms.
Pitfalls that distort interpretation
- Treating intensity as concentration. Absolute MS responses vary from day to day with source cleanliness, ion suppression and vacuum. The Pitt review says internal standards, ideally stable-isotope labelled, are needed for reliable quantification.
- Ignoring TFA. Trifluoroacetic acid left from synthesis and purification can influence ionisation and the counter-ion content of a sample. Our note on TFA removal from peptides covers the options.
- Poor sample preparation. Peptide that has not fully dissolved gives weak or erratic signals. The peptide solubility guide explains how charge and solvent choice interact.
- Unchecked system performance. A drifting retention time or mass axis misleads every assignment. Our page on HPLC calibration peptides describes standards and checks for the LC side.
- Column and system choice. Resolution affects how cleanly a minor species separates from the main peak; HPLC versus UPLC compares the two for peptide purity work.
Reporting LC-MS results so others can reuse them
A spectrum without its method is hard to interpret later. The mQACC recommendations ask for the column, elution programme, flow rates, injection volumes, source and MS/MS parameters (scan range, resolution, scan rate, collision energies) and any lock-mass calibrant. They also ask for run order, batch size and QC frequency, typically 5 to 10% QC samples, with acceptance criteria stated and confirmed as met, and objective justification for any excluded data. The companion minimum reporting standards document adds system suitability samples, internal standards, blanks and pooled QC composition, plus deposition of QC data in a repository.
For structural work, the HDX-MS recommendations in Nature Methods add that intact protein mass spectra should be used before the experiment to confirm purity, expected sequence and post-translational modifications. They also call for independently generated technical replicates and the use of multiple charge states to add certainty. Even if you do not work in that field, the principle applies: starting material of confirmed identity makes every downstream spectrum easier to read.
Starting from material you can verify
Interpretation is simplest when the sample is what it should be. BioForgeUK supplies research peptides at 99%+ HPLC purity, with Certificates of Analysis, for laboratory and scientific research only. Products are not for human or veterinary consumption, as set out on our Research Use Only page. If your team needs a defined peptide to compare against its own LC-MS data, you can browse the range at bioforgeuk.co.uk.

Our perspective
Most spectra that confuse people are not hard because of the chemistry. They are hard because the reader started with the wrong question. Start with "which scans built this picture?", then "what charge is this ion?", then "does the neutral mass match the sequence?" In that order, nearly every puzzle shrinks.
We build our offer around the same discipline. Our research peptides are supplied at 99%+ HPLC purity, with stringent quality controls, verification processes and Certificates of Analysis, because a laboratory should not have to wonder whether an unexpected peak is its own method or its starting material.
Every product is for laboratory research use only. That clarity lets scientists, institutions and students concentrate on the interpretation, which is where the real work is.
Neil
FAQ
How do I read an LC-MS graph?
Start by checking the horizontal axis. If it shows retention time, you are looking at a chromatogram and should note peak positions and heights. If it shows m/z, it is a mass spectrum, and you read the ions that make up a single peak, their charge states and their adducts.
What is the difference between a chromatogram and a mass spectrum?
A chromatogram plots signal against retention time, so it shows when compounds elute. A mass spectrum plots relative intensity against m/z at one time point or an average of several, so it shows which ions are present. Together, they let you identify a compound by both when it elutes and what it weighs.
Why does one peptide give several peaks in the mass spectrum?
Peptides pick up more than one proton during electrospray ionisation, so the same molecule appears as 2+, 3+ and higher charge states, each at a different m/z. Adducts with sodium or potassium add further peaks at fixed offsets. Deconvolution turns the series back into a single neutral mass.
Can LC-MS tell me a peptide's sequence?
Intact-mass LC-MS confirms the molecular weight but not the order of residues. To read the sequence you need MS/MS, where the precursor is fragmented and the y and b ion series are interpreted. Summing the residue masses should reproduce the precursor mass.
Sources
- Shimadzu: Data obtained from LC-MS
- Louail and Rainer: Exploring and analysing LC-MS data with Spectra and xcms
- MassSpec.Tips: Reading chromatograms
- Shimadzu: Fundamental LCMS principle guide
- Agilent: Basics of LC/MS, a primer
- Pitt: Principles and applications of liquid chromatography-mass spectrometry in clinical biochemistry
- Waters LC-MS primer
- Gatto and Loriot: Mass spectrometry, Omics Data Analysis
- UAB: Principles of pre-processing LC-MS-based untargeted metabolomics
- Separation Science: Peptide sequencing, Part 2
- mQACC: QA and QC reporting recommendations
- mQACC: Minimum reporting standards document
- Masson et al.: HDX-MS recommendations, Nature Methods